Browser developer tools offer a whole arsenal of interesting features. We’ve already covered some of them, but now let’s focus on CSS animation, layer handling, site rendering, and repainting. At first glance, working with animation in the browser might seem impossible, but guess what—it’s actually doable. DevTools allows you to manipulate animations and visuals: adjust, control, fine-tune, and inspect them. Sure, the usefulness may vary from person to person, but the fact remains—this tool is available and right at your fingertips.
As usual, let’s note that developer tools are nearly identical across browsers. So, if we previously focused on Google Chrome, this time we’ll use Opera.
As an example, let’s take a simple color-changing animation on hover. In its default state—gray, and when active within the viewport—bright orange. The animation is smooth and quick, but we’ll make it slower and longer. We’ll also use another animation set .
Basic Animation Features
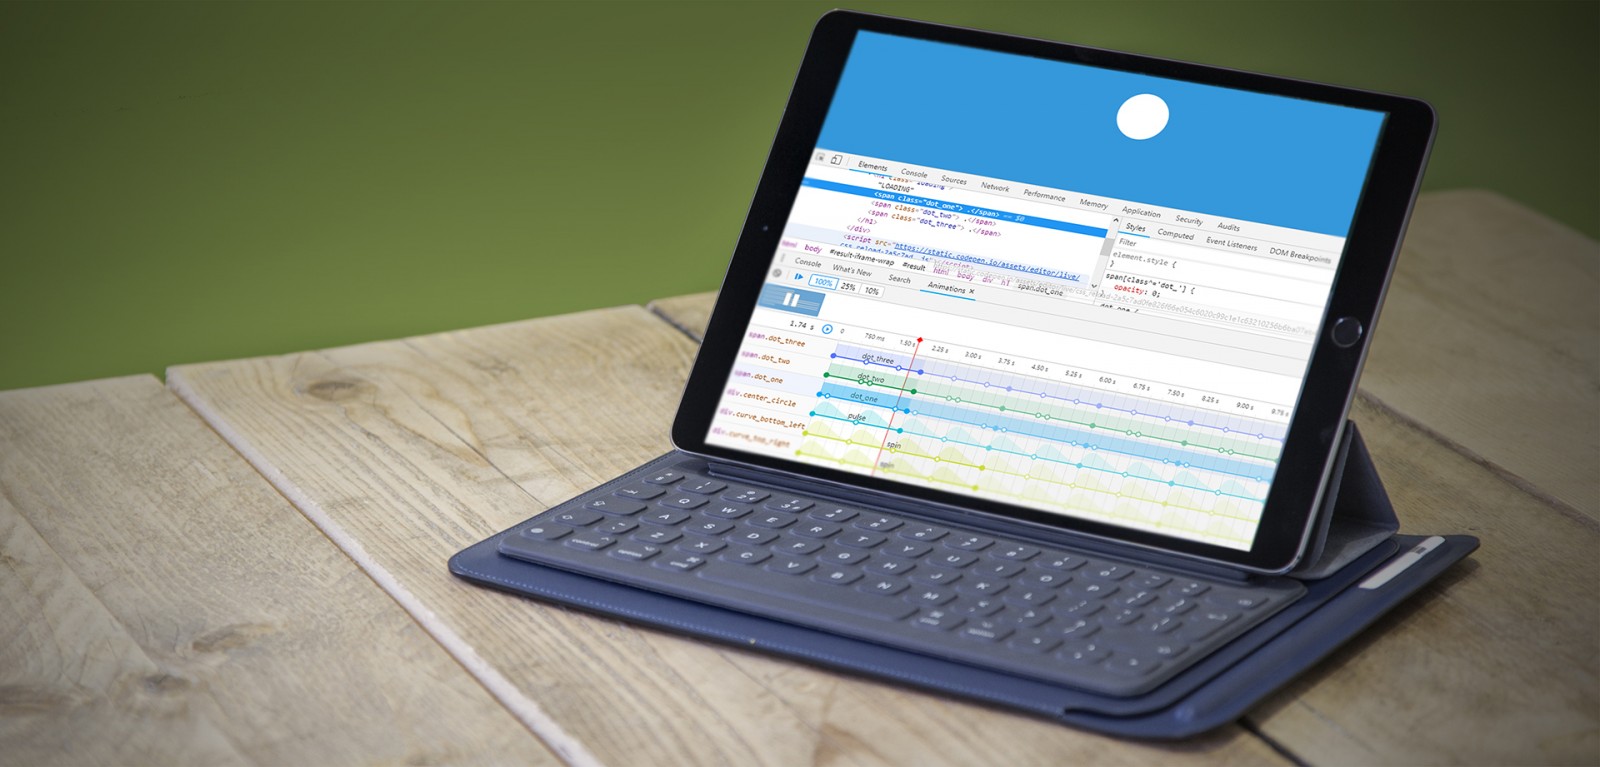
To access the tool, go to the menu by clicking the three dots (top right) → More tools → Animations. A new panel will appear. It’s initially empty, and you have two options: either hover over the animation or reload the page. In either case, small blocks representing all animations on the page will appear at the top of the panel. For example, we minimized part of the panel, moved the top section of the CodePen window, expanded the dev tools panel, etc. All of this triggered animations, and thus they’re visualized as blocks along a timeline.

Here, you can choose which animation you want to inspect: specific ones (icon, color change, etc.) or all possible ones (like when resizing windows on the page). Let’s go with the second option (the third block) and observe our animation curve.

When you pause, a red vertical line appears that can be moved with the mouse to locate specific animation moments. For instance, at the beginning we still have dark gray, and by the end, the color has shifted to orange. If the animation were continuous and repetitive (like falling snowflakes), the curve would be longer and wavy, representing repeated actions for each flake. We’ll return to such examples later.
Why It's Useful for Web Coders
So why would a regular web coder need this tool built into the browser? For different reasons, though not always. For example, if a site includes animation, DevTools is at least a quick way to adjust it. You can extend the duration by dragging the right control point. This change is applied automatically to the code and visible in the Styles tab. After that, you can resume the animation and preview the result on the page. We extended ours to 1.18 seconds.

You can also change the animation curve. It’s not super easy—you’ll work with a Bézier curve, which graphically represents timing. There are two options: use built-in presets on the left or create a custom curve and copy the generated CSS code from the Styles tab into your own project. At the top of the pop-up window, there’s a bouncing ball animation preview showing how each timing style behaves with Bézier curves.

For example, the second cubic-bezier option allows for a smoother, more gradual color transition that ends almost instantly. Meanwhile, the default ease shows gray for longer, then quickly switches and holds orange longer.


If keyframes exist (like in the example below), you can move and edit them. Just note that changes won't show in the Styles tab—you'll have to apply them manually. But you can see what those changes are, like which millisecond marks the next keyframe. Changes are made in percentages. For instance, a keyframe at 1.50 seconds in a 2-second animation is 75%. The screenshot shows such a change for the second point in “Loading…”.
Also note the repeating animation and curve on the timeline, as mentioned earlier.
.jpg)
Overall, the animation panel in browser DevTools is a great helper when working on site layout . You don’t need to constantly edit code in your app, copy it, upload to the site, and test. You can check and adjust everything right here, visually, and only then copy the resulting code. We’ve previously shown how to save changes made in DevTools locally .
Working with Layers
But it wouldn’t be complete if animation tools were the only helpful feature in DevTools. That’s not the case. There’s also visualization of layers (rendering, repainting, reflow), which make up animations. This visualization gives you a new “perspective” and is available under the Layers tab. Though this tab isn’t only for animations.
Click again on the three dots (menu top right) → More tools → Layers. At first glance, it looks confusing, but let’s try to view our color change from a side angle. In the toolbar, choose rotate mode to rotate layer objects in the central window. You can uncheck Slow scroll rects for better visibility. We end up with many layers—initial loading, resizing windows in CodePen, animations… all while layers were created and rendered.

Layers and Site Performance
Now let’s discuss how the Layers panel affects site performance. To keep it simple: the browser creates layers to place page elements and redraws them when needed. Sometimes a single element triggers a full page repaint, which slows down the site. Everything runs fast when the page shows just one static frame. But when there’s any interface change (e.g., scroll, animation), the browser has to generate a series of frames. These object changes lead to repaint and reflow—either with or without affecting size and positioning.
In 3D layer view, clicking on an object shows the total number of layers and details of the selected one. This helps you understand why some elements are marked as separate layers even when they shouldn’t be, or how redrawing one affects others. For example, why repaint the entire animation if you could just update elements on a single layer? This insight helps you better structure and place elements.

Here’s an example of a star rating animation and layer structure. When clicking the last two stars (right side), no style changes occur (no reflow). But selecting the stars on the left triggers a repaint of the entire document below the widget. Why? Because the stars weren’t layered above the "Heart Rating" text. Changing the stars' z-index removed the repainting. The page now loads slightly faster.


This is a simple example of why the Layers panel exists and how rendering and repainting work in the browser. Of course, all of this may take only milliseconds and go unnoticed—but it’s still useful to keep in mind.
Layers take up PC memory—the more interaction, the more layers. But the key isn’t just layers—it’s how updates and rendering occur: is the entire document redrawn, or just a single element? The Layers panel helps figure this out, showing what affects what. Creating an animation as a separate file (like a GIF) is fine, but if user interaction is needed and animation is built with CSS, you need to approach it more carefully.
Conclusion
Maybe it was a bit chaotic, but we’ve explored how animation works in browser DevTools and how it can improve website performance. Our goal was simply to share this feature and give examples of how to use it.
Of course, for a typical cafe website with static menu info, dish photos, and fun food-drink combos, a small rating animation won’t slow down page loading. Noticeably slow it down!
But if the whole site is animated with tons of tech, 3D elements, or fancy menu tricks, then it’s worth checking how the browser renders the page, creates layers, places elements, and updates them. Yes, it takes time—but it’s worth it to make the final project truly impressive and showcase you as a pro web developer.